Abstract
Background
The immune system has been harnessed in the treatment of AML patients by eliciting the graft-versus-leukemia response after hematopoietic stem cell transplant (HSCT). Recently, several other immunotherapy modalities such as immune checkpoint inhibitors, leukemia antigen-targeted antibodies, and adoptive cell therapy have been studied with hope for less toxic and more effective alternatives to conventional chemotherapeutic regimes. Yet, little is known on the clinical significance of the pretreatment immune microenvironment. Here, we characterized the immunologic landscape of the AML bone marrow (BM) with a novel multiplex immunohistochemistry (mIHC) method to identify prognostic immune biomarkers.
Methods
Diagnostic-phase BM biopsies of AML patients (n=69) treated in the Helsinki University Hospital during 2005-2017 and non-leukemic controls (n=14) were collected. Using hematopathologic expertise, tissue microarrays (TMA) were constructed from duplicate BM spots and analyzed using mIHC combining simultaneously up to six out of 25 examined lymphoid, myeloid, and immune checkpoint marker. We complemented mIHC with machine learning-based image analysis. Immune cell subsets were compared with Mann-Whitney U test, and p-values adjusted with the Benjamini-Hochberg procedure (q-values). By combining mIHC findings with extensive diagnostic-phase demographic, peripheral blood and BM aspirate laboratory test, and treatment data, we developed a risk stratification model predicting relapse-free survival (RFS) using bootstrapped L1-penalized elastic net Cox regression. We validated results with diagnostic-phase AML BM aspirates (n=84) analyzed with flow cytometry (FC) in the centralized university hospital clinical laboratory (2005-2016).
Results
Unsupervised hierarchical clustering of integrated immune profiles separated AML patients distinctly from control subjects. In AML patients, immune cell subsets and phenotypes associated with anti-cancer immunity were decreased (e.g. lower granzyme B and CD57 expression in CD3+CD4+ and CD3+CD8+ T cells), while features of immunosuppression were accentuated (e.g. higher proportion of FOXP3+ CD4+ T cells and lower expression of class I HLA-ABC in all BM cells).
Higher levels of T cell exhaustion markers PD1+ in both CD4+ and CD8+ T cells (15.7% vs. 1.7% and 13.2% vs. 2.0%, q<0.001 for both), and CTLA4+ (2.0% vs. 0.9%, q=0.02) in CD4+ T cells were noted in AML BM.
Lower level of CD68+/pSTAT1+cMAF- (0.033% vs. 5.9%, q<0.001) and higher CD68+/pSTAT1-cMAF+ (24.8% vs. 1.7%, q<0.001), e.g. M1 and M2-polarized macrophages, were observed in AML vs. control BM, thus shifting the M1/M2 ratio from 3.5 in control to 0.0013 in AML BM. In addition, higher amount of CD11b+CD33+HLADR-, e.g. myeloid-derived suppressor cells (MDSC), were observed in AML BM (1.0% vs. 0.038% of all cells, q<0.001).
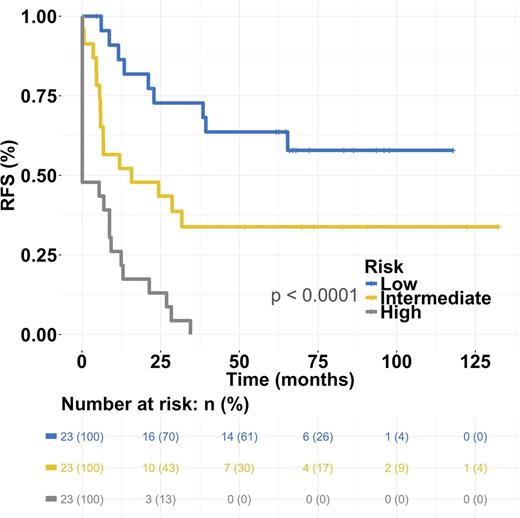
The most predictive features from the L1-penalized regression analysis were selected with multivariate Cox regression. High patient age and low amount of CD3-CD56+ (NK) cells were significantly associated with worse RFS both in univariate and multivariate setting after adjusting for induction therapy protocol (AUC 0.84 and R2 0.45, p<0.001 log-rank test). Interestingly, the model predicted also overall survival (OS) (AUC 0.86 and R2 0.38, p<0.001). The model was categorized into even-sized low, intermediate (hazard ratio (HR) 2.5, 95%CI [1.1-5.6]) and high-risk groups (HR 8.3, 95%CI [3.7-18.8]) to predict RFS (Fig 1).
In the independent validation cohort, CD45+CD2+CD3- (NK) cell count was categorized into even-sized groups based on tertiles. Low and intermediate NK cell count (<0.75% and 0.75-2.0% of all cells, respectively) predicted worse RFS (HR 3.3 p=0.005 and HR 2.2 p=0.05) and OS (HR 2.6 p=0.03 and HR 2.3 p=0.05) after adjusting for induction therapy protocol and HSCT.
Conclusion
Tissue cytometrics of TMA slides with mIHC and automated image analysis enable fast and objective single-cell phenotyping of large patient cohorts. The AML BM is characterized by myeloid and lymphoid lineage immunosuppression. Results of immune cell analyses with both mIHC and FC suggest low NK cell count as biomarker of poor RFS and OS. Other treatment response and survival endpoints remain to be analyzed and complemented with extensive flow cytometric, cytogenetic and molecular genetic data.
Porkka: Novartis: Honoraria, Research Funding; Pfizer: Honoraria, Research Funding; BMS: Honoraria, Research Funding; Celgene: Honoraria, Research Funding. Mustjoki: Novartis: Honoraria, Research Funding; Pfizer: Honoraria, Research Funding; BMS: Honoraria, Research Funding.
Author notes
Asterisk with author names denotes non-ASH members.


This feature is available to Subscribers Only
Sign In or Create an Account Close Modal